

In a region undergoing rapid economic change, a sharp, data driven comparison between Kenya’s KCB Group and Ethiopia’s top banks Commercial Bank of Ethiopia (CBE), Awash Bank, and Zemen Bank reveals the true financial leaders and laggards.
Kenya’s KCB group has long expressed interest in entering the Ethiopian market and with recent financial sector reforms that possibility is quickly becoming real. As the country opens its banking industry to foreign players, KCB is seen as a front runner. This comparison isn’t theoretical, it prepares grounds for investors, analysts and everyday consumers to understand how KCB stacks up against Ethiopia’s leading banks.
Note: Using the latest audited reports available noting KCB’s fiscal year ends December 31, 2024, while Ethiopian banks’ reports end June 30, 2024, a crucial 6 month difference, this analysis uncovers critical strengths, weaknesses, and efficiency gaps. Currency conversions use July 13, 2025 exchange rate 1 USD = 136.9 ETB and 1 USD = 129.5 KES not historic rates, so figures represent current value equivalents, not exact past transaction values.
The Numbers: Revenue, Profit, and Scale
KCB’s Regional Might vs Ethiopia’s Giants
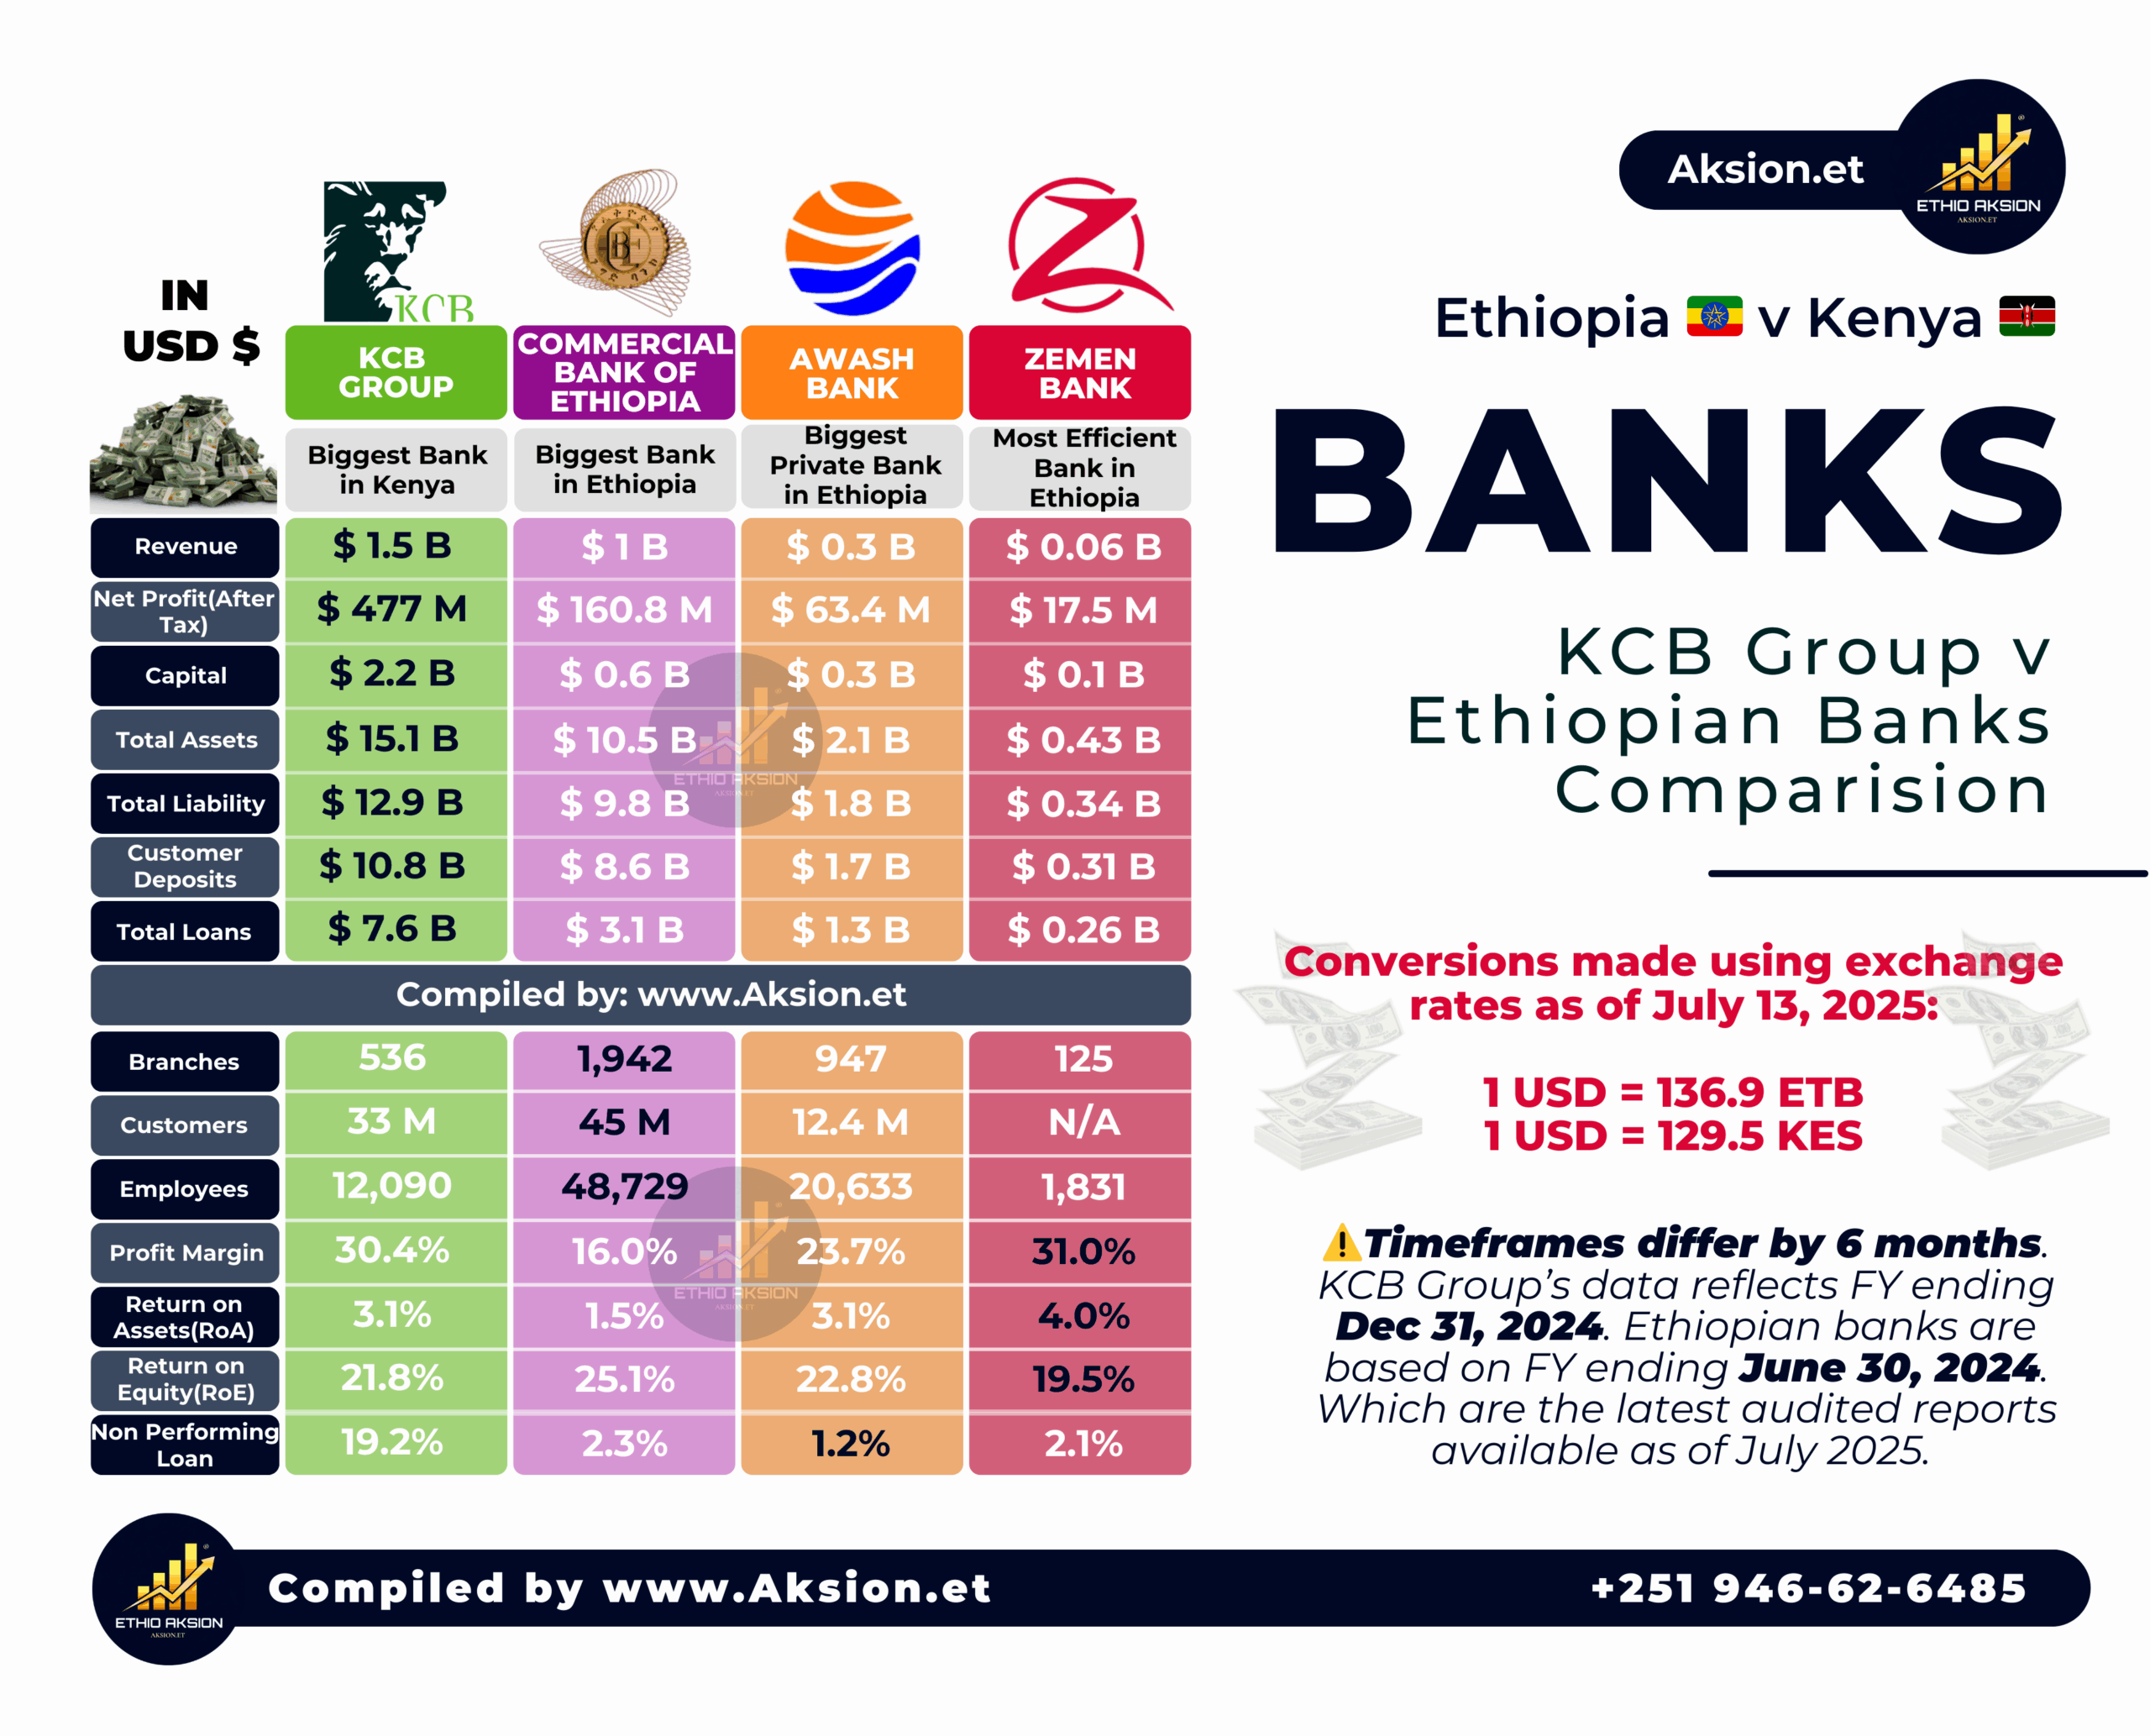
| Metric | KCB Group (Kenya) | CBE (Ethiopia) | Awash Bank | Zemen Bank |
|---|---|---|---|---|
| Revenue (USD) | $1.5 Billion | $1.0 Billion | $300 Million | $60 Million |
| Net Profit After Tax | $477 Million | $160.8 Million | $63.4 Million | $17.5 Million |
| Capital | $2.2 Billion | $600 Million | $300 Million | $100 Million |
| Total Assets | $15.1 Billion | $10.5 Billion | $2.1 Billion | $430 Million |
| Customer Deposits | $10.8 Billion | $8.6 Billion | $1.7 Billion | $310 Million |
| Total Loans | $7.6 Billion | $3.1 Billion | $1.3 Billion | $260 Million |
| Branches | 536 | 1,942 | 947 | 125 |
| Customers | 33 Million | 45 Million | 12.4 Million | N/A |
| Employees | 12,090 | 48,729 | 20,633 | 1,831 |
| Profit Margin | 30.4% | 16.0% | 23.7% | 31.0% |
| Return on Assets (ROA) | 3.1% | 1.5% | 3.1% | 4.0% |
| Return on Equity (ROE) | 21.8% | 25.1% | 22.8% | 19.5% |
| Non Performing Loans | 19.2% | 2.3% | 1.2% | 2.1% |
Breaking It Down: What These Metrics Mean
Scale and Reach
KCB Group dominates in revenue $1.5B and asset size $15.1B, but Ethiopia’s Commercial Bank commands a far larger physical footprint 1,942 branches vs 536 and 45 million customers compared to KCB’s 33 million. This disparity reflects different banking models: KCB focuses on efficiency through fewer, larger branches, while CBE’s broad network meets Ethiopia’s dispersed and rapidly growing market.
Profitability and Margins
While KCB’s profit margin is a strong 30.4%, it is narrowly outperformed by Zemen Bank’s 31% margin despite Zemen being significantly smaller. Awash Bank, with 23.7%, offers moderate profitability, but CBE lags with a 16% margin, highlighting operational inefficiencies.
Asset Utilization and Efficiency
Zemen Bank’s 4.0% return on assets ROA confirms it as Ethiopia’s most efficient bank. It generates more profit per dollar of assets than larger peers. KCB and Awash tie at 3.1% ROA, while CBE’s 1.5% lags considerably.
Credit Risk
KCB’s non performing loan NPL ratio of 19.2% stands as a glaring red flag nearly tenfold higher than Ethiopian peers. Ethiopian banks’ conservative risk culture shines: Awash leads with 1.2% NPL, followed by CBE and Zemen at just over 2%.
Important Context: Timing and Real World Shifts
These figures compare financial reports offset by six months KCB’s December 2024 data versus Ethiopian banks’ June 2024. Since then, Ethiopia’s banking sector has experienced dramatic profit growth in 2025, driven by government led foreign exchange liberalization and reforms.
Preliminary data shows banks like Awash and Zemen Bank more than doubling their profits, meaning the current reality is stronger than these numbers imply.
Final Verdict
- KCB Group: Strong profitability but high credit risks.
- CBE: Massive scale but inefficiencies drag margins.
- Awash Bank: Solid mid tier performance.
- Zemen Bank: Smallest but the efficiency leader.


Leave a Reply